

Trading with Candlestick Chart
Description of Trading with Candlestick Chart
Trade financial instrument (Such as Forex, Stock/Shares, Option, Gold, Commodities, etc) is a challenge especially if you are a beginner. To success, you must have enough knowledge how to trade. How to use Technical Analysis (TA) indicator to do the trade in right way.
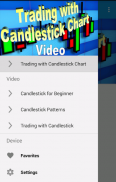
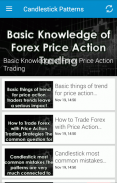
"Trading with Candlestick Chart" app is a way to know how to trade. Install it and you will learn how to trade by using candlestick chart/patterns. This app presents the complete video of using candlestick chart/pattern for trading. After watch all videos, you will know how to use candlestick for successful trading.
A candlestick chart (also called Japanese candlestick chart) is a style of financial chart used to describe price movements of a security, derivative, or currency. Each "candlestick" typically shows one day; so for example a one-month chart may show the 20 trading days as 20 "candlesticks".
It is like a combination of line-chart and a bar-chart: each bar represents all four important pieces of information for that day: the open, the close, the high and the low. Being densely packed with information, they tend to represent trading patterns over short periods of time, often a few days or a few trading sessions.
Candlestick charts are most often used in technical analysis (TA) of equity and currency price patterns. They appear superficially similar to box plots, but are unrelated.
Trading with Candlestick Chart - Version 1.0
(27-03-2018)Trading with Candlestick Chart - APK Information
APK Version: 1.0Package: com.AnDevStudio.Trading_Candlestick_Chart_Patterns_VideoLatest Version of Trading with Candlestick Chart


Apps in the same category

You may also like...